(adsbygoogle = window.adsbygoogle || []).push({ google_ad_client: "ca-pub-4811569576492328", enable_page_level_ads: true }); Beyond The Technical Analysis Expended Beyond The Technical Analysis Expended
  • Beyond The Technical Analysis Expended
    “Education breeds confidence. Confidence breeds hope. Hope breeds peace.”
    Technical Analysis in called an art to forecast price movements.
    Understanding and having command on these absurd looking lines can make you richest man in the world.
    Welcome to my Technical Analysis Tutorial Blogs

Trend Bars - A Simple Way to Look at Price Action

Understanding price action is simple.
I am not talking about trading price action, but just reading it. I am referring to grasping what the market is doing right now.
Price action results from the struggle between buyers and sellers. It is the footprint of the fight between the bulls and the bears. When you look at a chart, it makes sense to focus on finding the bulls and the bears.
The only concept you need is the Trend Bar.

What is a Trend Bar?

 A Trend Bar has a body that is greater than 50% of the entire bar range.

If a Trend Bar closes above its opening price, it is a Bullish Trend Bar.
If a Trend bar closes below its opening price, it is a Bearish Trend Bar.

Guidelines for Reading Price Action with Trend Bars

  • Consecutive Trend Bars in the same direction display strength. Recognize it.
  • Opposing Trend Bars imply a fight between the bulls and the bears. Find out who wins.
  • Isolated Trend Bars are potential traps. Traps, by definition, are tricky. Is it really a trap?

Price Action Chart Examples

Let’s take a look at two detailed examples of this useful concept in action.

Chart Markup Legend

  • Cyan Background – Trend Bar
  • Blue Circle – Consecutive Trend Bars in the same direction
  • Pink Dash Circle – Opposing Trend Bars
  • Green Arrow – Isolated Bearish Trend Bar (possible bull trap)
  • Red Arrow – Isolated Bullish Trend Bar (possible bear trap)

Example 1: SPY Daily Chart


  1. Clear war zone with four consecutive alternating Trend Bars.
  2. Bulls tried to push back without much impact.
  3. Bears came back stronger.
  4. Both fights resolved in a bullish way. Likely that bulls have regained control.
  5. Bullish strength as expected.
  6. A fight that looked bullish. But we knew that the bulls did not have a clear win as the last extreme high was not exceeded.
  7. This thrust confirmed that the bears have taken over.
You can take a closer look at the red and green arrows. In the right context, they present solid bear and bull traps.

Example 2: ES Intraday 5-Minute Chart


  1. The session started with the bulls in charge.
  2. However, price soon stalled as both the bulls and the bears got involved.
  3. Bears were in, but lacked strength when viewed in context.
  4. Accordingly, this was an excellent bear trap. (Chance to buy.)
  5. The bulls won this fight as price broke out above.
  6. More bullishness after some struggle.
  7. Sideways drift with two more instances of opposing Trend Bars. Bears win.

Open a Price Chart and Start Reading

This approach to reading price action is simple. This is why it works on all time-frames and instruments. (I selected the charts above at random.)
It takes some practice, but anyone can do it too. Open a historical chart, mark the Trend Bars, and practice how to interpret the constant price war.
After getting the hang of it, use the same method to understand the live market.
This is a price action method for understanding market movements. It’s not perfect, but it is a solid first step to understanding price action.

Disclaimer: Before using this website content, please make sure that you note the following important information- Trading in the stock market involves substantial risk. Visitors/Viewer/followers are advised, before making any investment decision from this Website content, you should do independent research. The use of this Website content for your own benefit is at your own risk. Owner will not be liable for any, direct or indirect, consequential or incidental damages or loss arising out of the use of this website contents. Please read carefully and you agree and understand about our Terms & Conditions and Disclaimer and Privacy Policy
Read more »

Be Careful ! These 4 things that can make you fail in Stock Trading

These few points will help you to not make mistakes I did and help you overcome some myths and notions associated with stock market trading . Just a request – Note that these learning have come from my trading in Options (which is derivatives) and not regular stocks, but that does not change the learning you are going to read below.


Mistake #1 – I focused too much on Knowledge

When I entered into stock markets, I was of the impression that I need to acquire a lot of knowledge on how things work, how various strategies work ? How technical analysis can help in trading ? I learnt all the technical indicators, back tested them on the past data, wrote lot of programming scripts to test my hypothesis.

I even went on to download lots of videos online and watched it over and over for many months and I realized that my knowledge had gone up significantly. I now understood lots of concepts, strategies, complex terms .

I could see a chart and instantly see lots of hidden patterns and could tell more than a normal person who does not know how to read a chart.

But then, over the months, I realized that “knowledge” is just a secondary element to trade successfully in stock markets. Almost all the good traders around the world agree that “knowledge” does not contribute more than 10-15% in being a successful trader. It’s an important thing , but certainty not the holy grail

I am not saying that one should not focus on “knowledge” part, all I am saying is that it’s not that KEY thing to succeed. Over knowledge will only create problems for you.

One of the famous stock trader Ashwani Gujral says in his book – “How to make money trading derivates” – that as per his experience over many decades, he feels that knowledge of charts etc contributes to just 10% of success for any trader. Here is the chart which explains what he mentioned in the book
So, learn things in stock market and then concentrate on the other important elements which you will learn in some time. Don't overthink about knowledge part.

Mistake #2 – I went against the Trend

What I have seen is that all the new traders somewhere want to challenge the markets and want to predict when markets will fall and when it will rise. They want to predict when the trend will reverse. They want to catch that top or bottom.
This is the essence of where most of the failed traders are stuck . If markets are rising , somewhere inside me, I wanted to catch the top and wanted to prove as if I “almost” know that now markets will fall OR if markets were going down.
However in this process, I realized that all the time I was just trying to swim against the trend, If markets were going up, I tried to predict when it will fall and how much and vice versa, and in that process I never stayed with the trend. There was some kind of fun in going against the trend. It was very tough to accept that markets can be simple (not easy)
Below you can see last 1 yr graph of NIFTY Index and see that there has been an uptrend in market and it has risen from 6000 in 2013 to around 8000 now . That’s 33% increase , but imagine someone who didn’t stay with the trend and always tried to predict when will market fall and looked at markets with suspecting manner and never got in the trend itself.


So just make sure that you never go against the flow in general. If I have to compare this trend following with some adventure sports, then I will compare it with Surfing, where you ride on the flow of the water. The flow of the water itself will take you with it, you just need to stay with it. Imagine what happens if you try to go against the water flow, the chances of you getting crushed is high.
So, try to identify the overall trend (upside , downside) and then make sure whatever is your trading style , be with the flow itself.
There is nothing wrong in having a contrarian view and predict when the markets will turn its direction, but be sure you know how you will take that decision. You can surely take a call against the trend , but make sure you accept that you were wrong in case you fail. Don’t try to prove yourself right if you are wrong, because it’s only going to harm you.

Mistake #3 – I didn’t realize that Money management is supreme

I personally think this is the most important part of being a successful trader . The biggest reason for my failure was that – I was very casual about money management and made the biggest mistakes in this area. Money Management in context of trading is all about managing your overall money and how much part of your overall trading capital you put at risk in each trade.
I will give you an example – Let’s say you have set aside Rs 10 lacs for stock market trading . Now let’s say you make 2 rules
Rule 1 : You will never use more than 20% of your capital in any given trade, no matter how promising it looks to you. Which means out of Rs 10 lacs you have , you will not put more than Rs 2 lacs on any single trade (so even in worst case, you will lose only 20% of your capital)
Rule 2 : The maximum loss you will allow on any give trade is 10% , which means that if you put Rs 2 lacs on a trade, you will not let the loss cross 10% , which is just Rs 20,000
If you see these 2 rules, you can see that the maximum loss in any single trade will not be more than Rs.20,000 which is 2% of your overall capital. So assuming you make 1 trade each month, you have 50 months of quota with you to go wrong fully
No one is so bad that they will make bad decisions every time, you make good and bad both decisions , but important point is that you should survive in markets till that time when you start taking right decisions .. Hence it’s important to be in the game and unless you take money management very seriously , you are bound to get out of the game some or the other day.
This is exactly what happened with me. By the time I started realizing that I am moving from “bad trader” to an “average trader” zone , my capital was over and I was already in loss and I never went back to the game itself.

Why one should use Money management ?

The biggest reason why money management should be used is that it does not expose you heavily to the risk on a broader level, even if there is very high risk on individual trades.
And the next big reason why money management is crucial is that it brings some kind of consistency in your growth overtime.
Below you can see 3 versions of money management, which is BAD , Average and GOOD money management, where the overall risk taken on a single trade is moving from high to low.
I did some simulation on excel where we are measuring how capital will grow over 36 months (assuming 1 trade is done in a month) . I ran 25 tests and plotted them on a graph together. You can see how in case of bad money management the growth of capital is very random, unpredictable and varies from very high (lucky) to very low (unlucky)
But in case of good money management , the growth of capital a trader has moves up over time and with high consistency .
So to sum up , I would say money management system is like having a great stamina . If you are there for longer time in markets, in a way you win the battle to some extent.

Mistake 4# – I thought trading is all about WINNING

Psychology plays a big role in being a good trader. From the childhood we are programmed to WIN and that same mindset takes over rational thinking in stock markets trading too. We want to WIN on all the trades , It’s hard to accept that you were wrong , being wrong means taking a LOSS . LOSS equals FAILURE and we are never taught properly how to take failures. And that’s exactly what happens in trading, novice traders don’t cut their losses fast, they let them grow (ego) and keep hoping that they will WIN
This is what also happened with me. When I bought an option for a stock, every time I wanted to WIN, every time I wanted to make profit on that option. I thought I will become a great trader , if I WON more and more ..

I was so WRONG

Winning MORE times is not same as making MORE money in stock markets trading. I know some of you who are reading this are confused with this statement , but let me explain this important point
So when it comes to stock market trading, you can’t choose how many times you WIN or LOOSE, but can control HOW MUCH you will win or lose !

All you can do is 3 things

1. You can control how fast you can get out of loosing trade (getting out of a bad decision)
2. You can control how long you will stay with a winning trade
3. And You can control when you will take the decision using your knowledge.

WINNING MORE , but still LOOSING

Every trade you make in stock market, you should make sure that your profits potential is generally much higher than the risk potential. Here is how it should look like

It’s very much possible that a trader wins 6 out of 10 times and still looses the money and in the same manner, it can happen that a trader wins just 4/10 times and still makes a lot of money.
Let me explain this with an example. Let’s say a person has Rs 10 lacs to start his trading .
A good trader wins just 4 times, but he makes sure that he will make big win and every time he makes a bad decision, he cuts the loss fast.
And in same way, a bad trader might win 6 times , but every time they are in hurry to book their profits (so they earn small every time) and when they are in loss, they do not book their losses fast (no money management rules in place) and hence let their losses grow because they can’t accept they made mistake (Ego) . The chart below will explain you this .

This is the only big difference between a good trader and bad trader .

Conclusion

Today I have shared my mistakes I did when I traded OPTIONS and I hope you will learn from my mistakes . But this can just be starting point only, you will only learn when you get on the ground and do the real trading. Till then it’s just a practice no matter what you do.
It’s extremely addictive to trade and if you are like me, you will feel a great thrill trading either stocks, futures or options (or any other instruments) , while I didn’t succeed in trading, I at-least know why I failed, I at least came to know my weakness and now I can improve upon it. I can at least help others to not make the same mistakes I did.
Also in future, if I get into trading again, I am sure I will be 10X better compared to earlier version of mine. I know it will still be very though, but I can try at least and when I stopped my trading, somewhere I felt bad about leaving it. I felt as if I am turning my back and got a feel of leaving the battle ground, but it was a right decision because I could have damaged my own net-worth to a big extent had I not stopped.
I would love to hear what you feel about the points I shared and if you would like to share your own experiences
Source: Collected from Internet.

Disclaimer:
Before using this post, please make sure that you note the following important notice. Information provided in this post for the educational & informational purpose only. Visitors/Viewer/ followers are advised, before making any investment decision from this post, you should do independent research. The use of this post or information for your own benefit is at your own risk.


Read more »

Relationship of Risk & Return


"Stocks are risky. Bank deposits are safe. Don't buy stocks! Keep your money safe." Haven't you heard such statements before? We are sure you have.


But before you decide to accept these statements on their face value, we suggest you understand the real relationship between risk and returns. To start with have a look at the average historical returns given by these 2 assets, i.e. stocks and bank deposits:

One glance at the table above and it becomes clear - which is the better asset to invest in,given the historical average returns. Another thing to note here is that returns given by bank deposits will be further reduced when we consider taxes.This makes stocks all the more better option for long-term investing.
But unfortunately, stocks don’t go up in straight lines. Stocks are volatile and can move up or down sharply. This is unlike bank deposits, which are almost guaranteed to give fixed returns promised at the time of booking the deposits. But before you draw a negative conclusion about stocks, it is important to understand that its the very nature of stocks (as an asset class), which makes it a volatile asset class for the short term. But when you increase the period under review, its found that stocks (and equity mutual funds) give much higher average returns than what is given by bank deposits, or for that matter, any other asset class.
Just have a look at the table below (which builds on the previous table):
Stocks are clear winner.
But nothing comes for free in this world. Same is the case with high returns of stocks. These come at a cost -higher volatility in the short-term.
Or looked at from another perspective, an investor in stocks needs to be compensated for taking higher risks. This is achieved by means of higher returns that stocks provide.
Understanding this relationship between risk and return is very important and can help an investor make correct financial decisions, based on their risk appetite and return requirements.
What is Risk?
A very formal definition of risk is the likelihood that actual returns will be less than historical and expected returns.
But to put it very simply, risk is the possibility of losing your money that is invested as principal. For example – You invest Rs 20,000 in stocks today. Next day, the markets go down and reduce the value of your investments to Rs 18,000. That is the primary risk when you invest in stocks.
But stocks are not the only assets that have risk. All investments have their own share of risks. The risks however vary in type and degree.
So even when you keep you money in bank deposits offering 5.5% returns (after-tax), there is another kind of risk that you are taking – inflation risk. Your investment might not keep pace with inflation, which will reduce your purchasing power in future.
Risk can come from many other factors too. Like volatility in stock markets, inflation, changes in currency exchange rates, changes in business dynamics, changes in economy, geo-political developments, etc.
But generally, the investments that are considered to carry higher risks have the potential to deliver higher returns. On the other hand, investments with lower expected returns (like bank deposits),carry lower risks.
What is Return?
This is quite simple. Returns are simply the amount you get (or lose) on the invested amount. It is generally calculated on an annual basis.
As mentioned earlier too, the asset, which gives higher returns, is generally expected to have higher levels of risk.
Risk – Return Relationship
There is a clear (if not linear) relationship between risk and returns.
Try finding an asset, where there is no risk. Chances are that you will end up with an asset giving very low returns. Again try finding an asset that offers very high returns. We are sure you would have chosen a very risky asset.
Now risk cannot be eliminated completely. At best, investors can manage the risk in their investments.
So when investing in shares, you can either have a concentrated portfolio of few stocks or a diversified portfolio of many stocks. The risk with holding a concentrated portfolio is that if value of even one company goes down, it will have a big impact on the overall portfolio returns.
Instead to reduce the risk, one can chose to invest in a diversified portfolio of stocks. This way, a fall in share price of even few stocks will not have a large negative impact on the overall portfolio returns. This is the exact principle on which fund managers build mutual fund portfolios.
Another way to reduce risk is to diversify across assets and hold a portfolio of stocks, bonds, bank deposits, gold and other assets. What happens then is that bank deposits, bonds, gold, etc. will provide stability to the portfolio, albeit at the cost of lower returns. Stocks on other hand will provide higher long-term returns and improve overall portfolio returns.
Time also plays a big role in deciding the returns obtained by investors. It has been empirically found that when investing in good stocks, the longer your investment horizon is, lower are the associated risks and returns are comparatively better than other asset classes. Having a long investment period averages out the short-term volatility of returns.
Humans have a tendency to reduce risk that they take. You too can choose to invest only in safe assets like bank deposits or hold cash. But then, your investments will lose value over time (due to inflation). And you don’t want that.
Its better to assess your risk tolerance and choose investments intelligently. Taking on some risk is necessary to achieve adequate returns. So try and find the ideal balance for your investments, which gives you the best risk-adjusted returns for your investments.


Disclaimer:
Before using this post, please make sure that you note the following important notice. Information provided in this post for the educational & informational purpose only. Visitors/Viewer/ followers are advised, before making any investment decision from this post, you should do independent research. The use of this post or information for your own benefit is at your own risk.

Read more »

Different Types Of Stocks

People invest in stocks to earn higher returns than what fixed income products offer. But all stocks are not same. Like the companies and businesses, the stocks of different companies also have different characteristics.
In general, companies issue stocks of two types – Preferred (have priority over other shareholders) & Common stocks. In line with its name, the common stocks are the first choice of retail investors. We will be focusing on common stocks in this article.
Let’s evaluate different stock classifications that are commonly used:

On basis of Market Capitalization
Stocks are often classified as large caps, mid caps, small caps and micro caps on basis of their total market capitalization (Current Share Price x Total Number of Shares). Though there are no exact cutoffs about what exactly is defined as a large cap and what isn’t, investors usually categorize companies under as follows:
  • Large-cap: Market Cap > Rs 10,000 Crore (Cr)
  • Mid-cap: Rs 2,000 Cr < Market Cap < Rs 10,000 Cr
  • Small-cap: Rs 200 Cr < Market Cap < Rs 2,000 Cr
  • Micro-cap: Below Rs 200 Cr
Also the concept of  Risk and Return  is applicable here too. Small companies are riskier than large ones. So due to the increased risk, many of the smaller companies tend to give higher returns than large or mid-cap companies. Of course, the proportion of small companies not doing well is also higher than those among their larger counterparts.
Many of the large cap stocks are of high quality, well-established companies with stable or growing earnings. The stocks of these companies are known as blue-chip stocks. The perceived risk associated with these companies is also very low. Examples - Many stocks that are part of Sensex or Nifty 50 index.

On basis of Growth / Value / Income
This classification of stocks depends on the nature of business, its profit distribution policy and general assessment of price vs. actual intrinsic value.

Growth Stocks
These are stocks of businesses, which are growing higher than average rate. This high growth is translated into higher profits, and is reflected in rise of company’s stock price. Because of this, these companies prefer to reinvest their earnings back into company operations in hope of generating more profits. This theoretically helps these companies grow at a faster rate. Consequently, these companies have low dividend payouts. Generally, the growth stocks are bought more for capital appreciation in stock prices and are riskier than other two varieties.

Value Stocks
These are stocks that according to some financial analysis ratios, are trading at prices that are less than their actual (intrinsic) values. Some of the popularly used ratios to assess reasonability of price against embedded value are:
  • Low P/E ratio
  • Low P/BV ratio
  • Low Price-to-Sales ratio, etc.
Value stocks don’t remain good value picks forever. When other investors realize that stocks are under-priced, the prices tend to rise up and reward those early investors who bought at lower levels.

Income Stocks
These stocks distribute a comparatively higher percentage of their earnings as dividends to shareholders. This often gives them high dividend yields (dividend  in relation to their share price). At times, these are also referred to as high dividend-yield stocks. A higher dividend means higher income and hence, the name income stocks. Generally, these belong to companies that have stable businesses churning out reasonable assured amounts of profits.
These are some of the more commonly used approaches to classify stocks. But stocks can also be classified in many other ways like defensive stocks, high beta stocks, etc.


↪Disclaimer:
Before using this post, please make sure that you note the following important notice. Information provided in this post for the educational & informational purpose only. Visitors/Viewer/ followers are advised, before making any investment decision from this post, you should do independent research. The use of this post or information for your own benefit is at your own risk.

Read more »

Option Put-Call Ratio

Guide to Put-Call Ratio


What is Put/Call Ratio?
Put/Call ratio (PCR) is a popular derivative indicator, specifically designed to help traders gauge the overall sentiment(mood) of the market. The ratio is calculated either on the basis of options trading volumes or on the basis of the open interest for a particular period.  If the ratio is more than 1, it means that more puts have been traded during the day and if it is less than 1 it means more calls have been traded. The PCR can be calculated for the option segment as a whole which includes individual stocks as well as indices.

How to Interpret Put/Call ratio

The Put/Call ratio is mainly used as a contrarian indicator. Markets in the short-term are driven more by the emotions than fundamentals. Times of greed and fear in the market are reflected by significantly high or low PCR. Contrarians say, PCR is usually headed in the wrong direction. In an oversold market, puts will be high; as everyone expects the market to fall more. But for contrarian trader, it suggests that the market may soon bottom out. Conversely, in an overbought market, the number of calls traded will be high expecting the market to trend higher but for contrarians, it would suggest that market top is in the making.

There is no fixed range that indicates that the market has created a bottom or a top, but generally traders will anticipate this by looking for spikes in the ratio or for when the ratio reaches levels that are outside of the normal trading range.

If options were held only to make directional bets, this analysis would have held true, however traders trade options for reasons other than making directional bet. Traders could buy options to hedge their existing position as well as to create income generation strategies. So with a combination of speculation and hedging activities, relying solely in terms of higher or lower number of Put Call ratio may not be fruitful.

Let’s see how vague PCR can be, if used in isolation.

Bank Nifty futures vis-à-vis Bank Nifty PCR 

In the above example of Bank Nifty, we had witnessed a steady increase in PCR from May 2016 to 15th July 2016. Con-currently we saw a rise in price of Bank Nifty as well. In Dec 2016 Bank Nifty resumed its fresh uptrend but PCR fell sharply. This contradicts with the relations experienced earlier. From May 2017 till July 2017, PCR has once again moved in tandem with Bank Nifty. PCR as an indicator on its own has flaws. PCR levels in a highly volatile market can be misleading as typically, during such times; traders tend to sell puts instead of buying calls. So, analyzing put call ratio based only on high or low PCR numbers could prove costly. Thus it is important to use Put Call ratio in sync with other trading activities.

PCR Analysis

Let’s see how PCR analysis can be interpreted taking option sellers into consideration who are the major players in the market as compared to the retail public who are usually on the buying side of the trade. 
 Traders can combine options data including the Put Call ratio with implied volatility to gauge if long or short positions have been created in the market.

1) Build-up in options along with increase in IV’s (Implied Volatility) suggests long formation

2) Build-up in options along with fall in IV’s (Implied Volatility) suggests short formation
Types of View based on Open Interest, Implied Volatility and Put Call Ratio:
Let’s see how the combination of the Scenario 4 & 8 from the above table provided a Buying signal before the big up spurt in Nifty.

Chart A –Nifty Futures July Series 

(Upper Sub Graph –Nifty Futures Price, Green Line –Nifty Futures Open Interest)

Chart B- Nifty 10,000 July CE

(Upper Sub Graph-Nifty 10,000CE, Blue Line –PCR, Red Line-Implied Volatility 10,000CE, Green Line –Open Interest 10,000CE)

Chart A: Nifty futures witnessed a swift increase in prices from 9650 levels to 9950 levels where the markets started to consolidate, coinciding with a gradual increase in Nifty futures O.I. Traders at this levels started to create fresh short position in the futures market, expecting the market to correct as the open interest surged higher along with a small drop in prices. 

Simultaneously in Chart B from 10th July to 20th July we witnessed call writing in OTM call option strikes including 10,000CE(as shown in the above graph) as the traders expected market to correct or remain range bound and not cross 10,000 levels in the current series. This is indicated by a decrease in PCR and increase in Open interest of Nifty OTM call options including 10,000CE strike during the same timeframe.

As price of Nifty futures started to increase from 23rd July, traders who were short in the futures market along with the call option writers had to run for a cover and close their short positions. This panic was observed by a sharp decline in the open interest positions of Nifty future contracts. In addition, implied volatility also tumbled along with an increase in Put Call ratio due to unwinding of open positions in short call option strikes.

Any smart trader, by analyzing the above mentioned positions in Nifty futures and call options could have taken a bullish stance by anticipating a huge short covering in the markets. 

-----------------------------------------------------------------------------------------------------------
↪Disclaimer:
Before using this post, please make sure that you note the following important notice. Information provided in this post for the educational & informational purpose only. Visitors/Viewer/ followers are advised, before making any investment decision from this post, you should do independent research. The use of this post or information for your own benefit is at your own risk.


Read more »

How to read Balance Sheet for Fundamental Analysis


By looking at the balance sheet of the company one can understand how the company has build wealth for itself and its owners over the past years.
Balance sheet of a company makes one thing clear about the business, it talks about from where the company is generating funds to run its business, and where the company is using those funds.
Any company generate funds in three possible ways. It can borrow money from stock market. This is called share capital in balance sheet.
The company can also retain its net profits to run the business. This is called reserves and surplus in the balance sheet.
Company can also borrow funds from Bank etc. This is recorded as long term borrowing and short term borrowing in balance sheet.
Hence, the total funds available with a company to run its business can be summed up like this:
Total Funds = Share Capital + Reserves + Debt.
{Note: Share Capital + Reserves = Book Value.}
This (total funds) is also called the total liability of the company.
How the company uses their generated funds is also indicated in the balance sheet.
Company use its generated funds to build assets. These assets intern generate income for the company.
Let’s see the important constituents of a balance sheet in more detail.
Balance sheet basically defines this equation:

If one read a balance sheet statement of a company, it will show how much accumulated wealth the company has amassed till that day.
Shareholders fund (Book Value / Net Worth)
Why it is called as shareholders fund?
Shareholders fund is that money that companies owe to their shareholders.
Shareholders have a legal claim on the company’s net profits. Hence any funds that is retained by the company (Reserves) goes into the account of shareholders funds.
Company consider these funds as that money which they need to pay-back to the shareholders one day.
Book Value = Share Capital + Reserves
Share capital: is that money that the company has generated from its IPO.
Share capital is actually the borrowed money that the company has taken from the shareholders.
It is also treated as companies liability.
Reserves :are also referred as retained net profits of the company.
Why companies retain their profits? This is done to strengthen their balance sheet (financial position).
Companies used a reserves to buy new fixed assets. This day 2 by means of capital expenditure plans (CAPEX).
Companies also use their reserves to reduce there debt burden.
A portion of reserves is also used to pay dividends to its existing shareholders.
General there are two types of reserves. First, revenue reserve and second, is called capital Reserves.
Revenue reserves is again categorized into two types, first he is general reserves and second is specific reserves.
As the name suggests, general reserves is not apportioned for any specific purpose. They are just kept in the balance sheet to strengthen the financial position of the company.
Specific reserves are those portion of money which is kept for specific purpose. The the funds kept in the specific reserve shall be used only for the designated purpose.
How the reserves in the balance sheet is funded every year?
The annual profits of the company that is shown as net profit, in profit and loss account, is transferred to the company’s balance sheet as retained earnings.
This retained earning in turn is used as the reserves of the company.
If the company has made a loss in a particular financial year, no transaction is recorded in the reserves column of the balance sheet.
Sometimes, in case of loss, the company may even debit there reserves account in balance sheet to meet their requirements.
In such case one will find a dip in the reserves and surplus account as compared to the previous year.
One of the most important financial indicator detailed in the Balance Sheet is shareholders equity. In doing a balance sheet analysis it plays an important role.
Net worth of a company is equal to total capital generated by the company by issuing stocks and accumulated retained earnings.
A continuously improving net worth is what investors likes to see in companies balance sheet.
Investors must compare last five years net worth of the company, and must also check growth rate.
It is important to check how the net worth of company has grown.
If increase in net worth is attributable only to the issuance of more stocks to public, then it is not good.
Ideally, the companies net worth must increase due to growth in retained earnings.
Liability
Non current liabilities
Non current liabilities are those liabilities of a company which is settled only after 12 months from the date of reporting.
These are such liabilities that company need not settle immediately.
If you will see in moneycontrol.com, you will find that non current liabilities are mainly recorded in two three some heads. First he’s long term borrowing. Second, is deferred tax liability and third is long term provisions.
Companies which show the line item has long term borrowing, means that the company has taken that from the market (mainly banks).
It is very important for the shareholders to keep a note of how high is the long term borrowings of the company as compared to its equity.
Deferred tax liability is a provisional fund maintained by the company using which they will pay the forthcoming additional tax dues.
Has a part of non current liability the company also hello kids some funds in the name of long term provisions. Here the company keeps some cash reserves for paying their employees. These payments can be like gratuity, provident funds, leave encashment. The provisions can also be made for income tax payment, payment of dividend to shareholders, dividend distribution tax etc.
Current liabilities
Current liabilities are those obligation of the company that they must meet before 12 months.
If you will look into balance sheet of any company in moneycontrol.com you will find four line items under the heading current liabilities. They are, short term borrowing, trade payables, other current liability and short term provisions.
Short term borrowing is essentially that loan that company has taken from Bank CTC to fund there day-to-day cash flow requirement. In financial term this is also called as working capital of the company.
Trade payable is that money that a company must pay to its suppliers within next 12 months.
Short term provisions are again similar to long term provisions. The only difference here he is, this provisions me get used within next 12 months.
Assets
Generally in the balance sheet, assets are categorised into two main types: non-current assets and current assets.

Non-current assets are basically property, plant, and equipment’s of the company. Normal terms we call it as fixed assets of the company (Tangible assets).
Fixed Assets (Tangible Assets)
Fixed assets adults assets of the company which they use directly for the production of goods and services for their customers.
Common examples of fixed assets are land, factory buildings, machines, furniture’s, Motor vehicles etc.
Fixed assets are those assets of the company which company gathers to hold them for long-term.
Contrast to the fixed assets, an inventory is also an asset of the company. But company maintains the inventory with the objective of selling them in near future.
Intangible assets
Assets of the company do not have a physical substance. You cannot physically see it and touch it. Example off in tangible assets can be like copyrights, trademarks, patents etc gathered by the company over a period of time.
Capital work in progress
These are those assets which were not ready at the time of preparation of the balance sheet. These are those assets which are still not ready to produce goods and services for the company.
Hence, call costs that has gone into the preparation of that as it is shown as capital work in progress off the companies balance sheet.
Just to understand, let’s take a small example. Pause cement manufacturing plant is putting up a new facility to manufacture a new brand of cement. Average it may take 3 years for the company to start production from this new facility. But the company will start spending money on this asset from the first months itself. So, the cost that was into the preparation of the new cement plant will be booked as capital work in progress for the next three years.
As soon as the new plant will begin production, all capital work in progress associated with this new plant will be transferred as tangible asset.
Non-current investments
Current investments are those investments made by the company which day would like to hold for more then next 12 months. Example of such an investment can be stockholding of another company.
Generally current investments are reported in the balance sheet equivalent to the market valuation of the investment.
Current assets
Current assets are those assets of the company which is expected to be converted into cash within next one year.
It is the current assets of the company that helps them to maintain enough liquidity.
Current assets of the company helps in management of the current liabilities.
One of the most reliable firms of current assets cash and cash equivalent, inventory, it’s investments, account receivables from its customers, and loans and advances given to associates/ suppliers. Advances are also referred to as pre-paid expenses in some balance sheets.
To Conclude

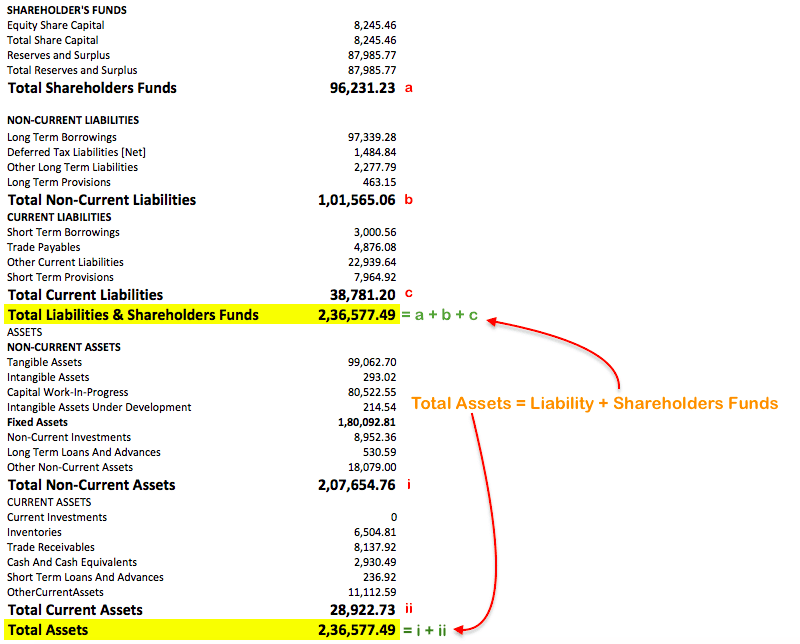
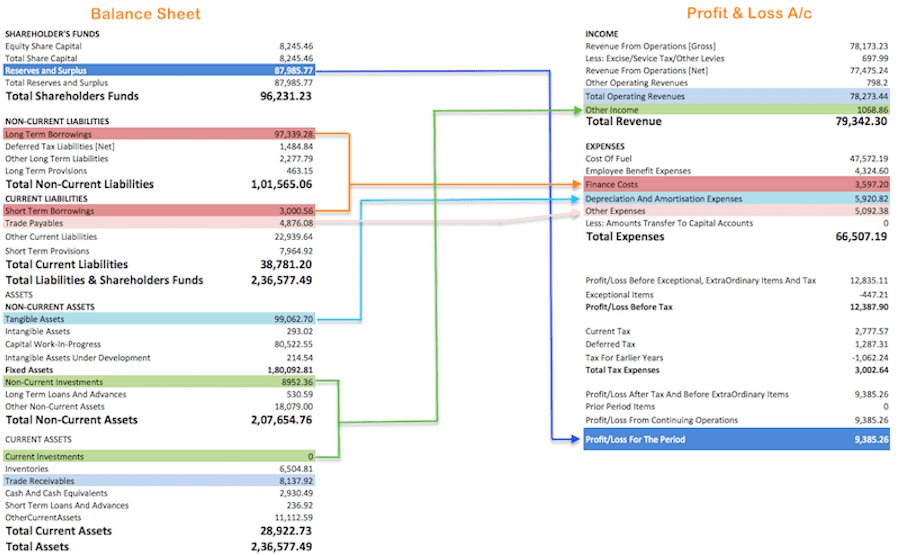
You can see the above snapshot of a typical balance sheet of a company and understand what is actually balanced in a balance sheet.
Total asset of a business is always equal to the sum of its total liability and shareholders funds.
How balance sheet is related with its profit and loss accounts?
Reserves & Surplus in balance sheet gets updates every time the company makes net profit (PAT). Net profit appears in companies profit and loss accounts.
Debt (long term and short term borrowings) in balance sheet increases the companies Finance cost which appears in companies profit and loss accounts.
Trade payables of the balance sheet is a portion of expense to be incurred by the company in the next financial year (FY). Companies often buy goods and services from the suppliers on credit. All expenses which are booked by the company appears in the profit and loss accounts.
Tangible assets valuation appearing in balance sheet are recorded as net of accumulated depreciation (over last several years of operation). Depreciation applicable only for a particular FY, appears in the companies profit and loss accounts.
Non-current and current investments made by the company is recorded in companies balance sheet. The income generated by these investments are recorded as other income in profit and loss accounts.
Trade receivables appearing in balance sheet of the company is the out of sales revenue. Companies often sell their products and services to their customers on credit. This credit payment due, to be paid by next months are recorded as trade receivable.

So now you can understand well, how balance sheet and profit and loss accounts communicate with each other.


Disclaimer: All blog posts of https://nse-bse-mcx-technicalanalysis.blogspot.com/ are for information only. No blog posts should be considered as an investment advice or as a recommendation. The user must self-analyze all securities before investing in one.
Read more »
 
SORRY ADBLOCKER DETECTED
It looks like you're using an ad blocker. That's okay. Who doesn't?
But without advertising-income, we can't keep making this site awesome.
Please disable your ad blocker and then reload the page to continue enjoying our site.
Reload Page
Beyond The Technical Analysis - Contact